Each flight log entry usually
represents a launch or test day, and describes the
events that took place.
Click on an image to view a larger image, and
click the
browser's BACK button to return back to the
page.
Day 106 - Measuring
bottle stretch thrust
Date:22nd
May 2011
Location:Workshop, NSW, Australia
Conditions: pleasant, temp ~20C
Team Members at Event:Paul K, John K,
GK
This week we take a detour from launching
rockets and go back to visit an experiment
that we've been wanting to do for a while.
Aim
Since a bottle stretches when pressurised,
how much energy is stored in the
bottle itself? How much of this energy is
returned during the thrust phase?
Experiment Setup
Background
In order to measure the stored energy
in the bottle walls we decided to completely fill the bottle with
water, pressurise it and measure the thrust
produced when it is released. Because water
is essentially incompressible at these
temperatures and pressures all the energy
that produces thrust should come from bottle
contraction.
In order to get an accurate thrust
measurement we needed to eliminate the
effects of gravity because the bottle would
get lighter as it expelled water.
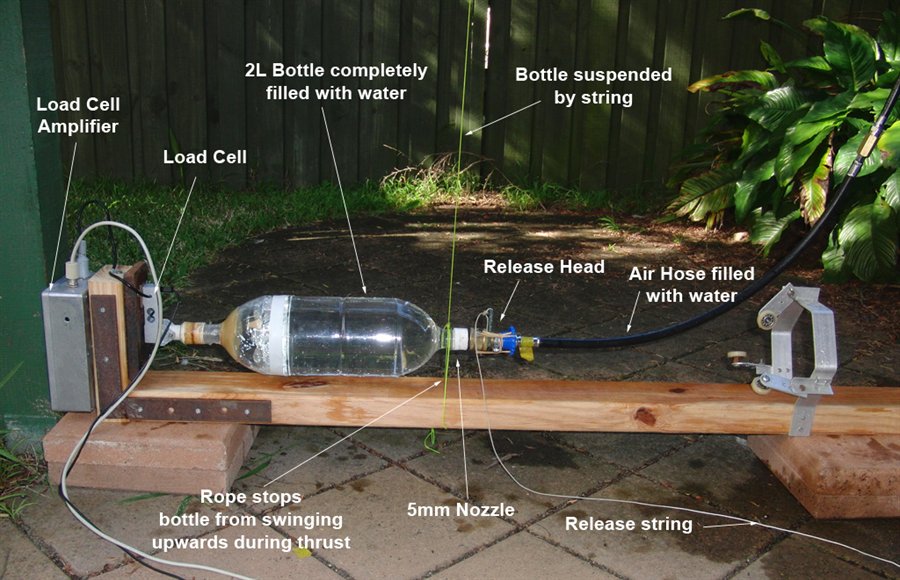
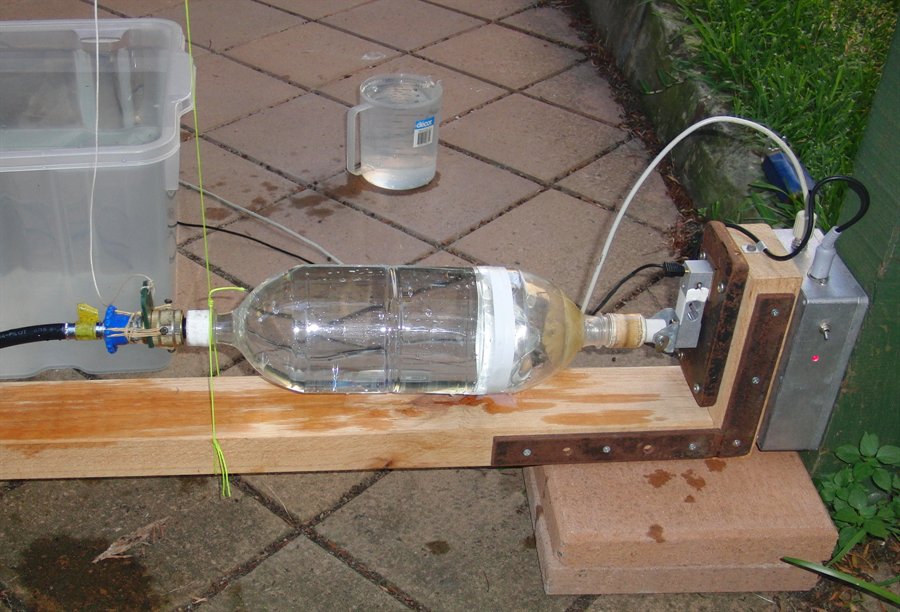
We suspended a 2L bottle horizontally so
that it was free to swing along it's axis.
We also attached the neck of another bottle
to the base of the test bottle so it could
be attached to a load cell. Another loop of
rope was used to stop the bottle from moving
upwards during the thrust phase.
Since the thrust phase was going to be
fairly short we used a small 5mm nozzle to stretch the
thrust curve out in time as we only sample
the load cell at 240Hz. The total impulse is
still roughly the same as if we had used a
larger nozzle.
Experiment Setup
Even the smallest
bubbles in the bottle can give significant errors in the
measurements
because air is compressible. In order to
prevent air entering the bottle during
pressurisation we filled the air hose
completely with water to fill the void as
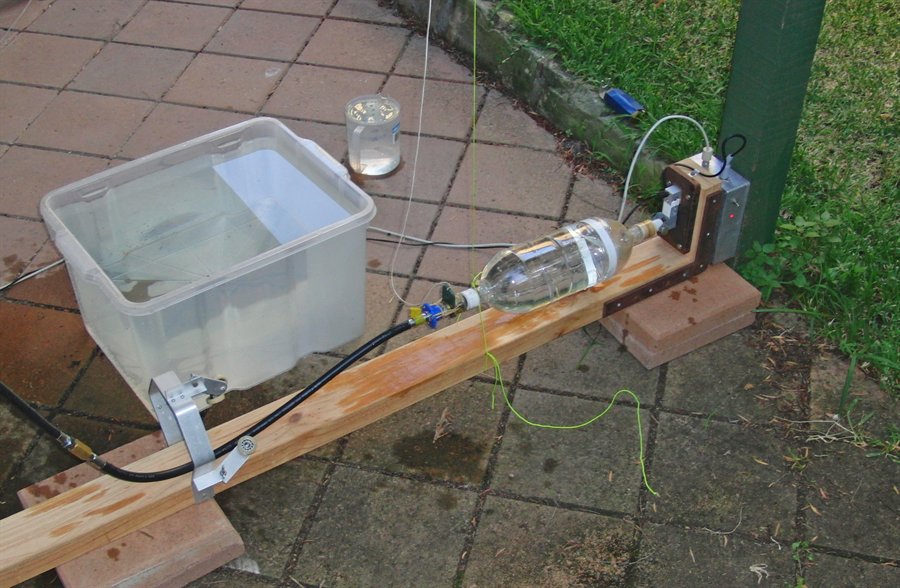
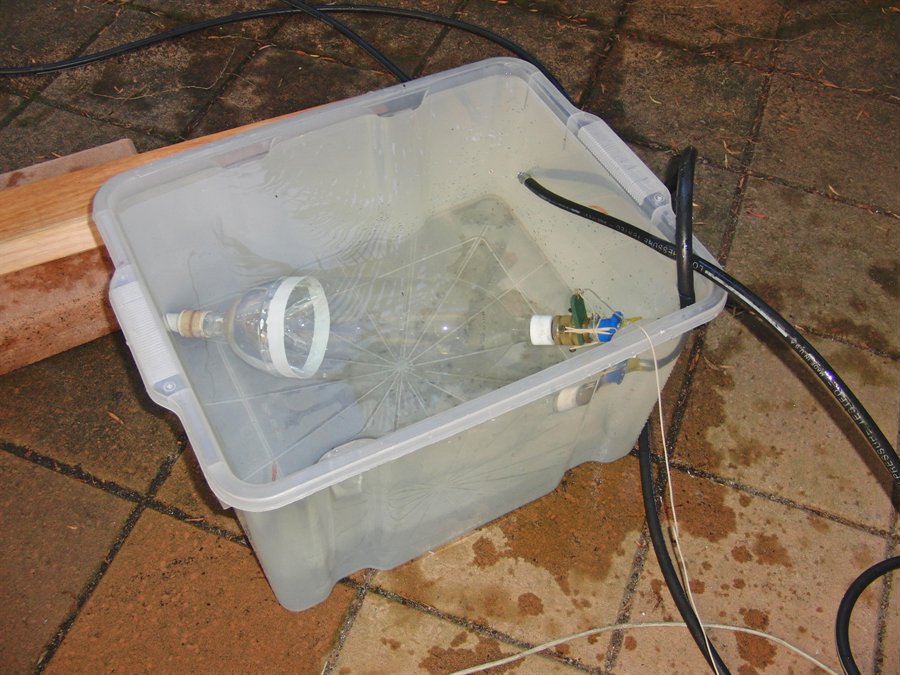
the bottle expands. We also submerged the
entire bottle in a tub of water and fitted
the nozzle, release head and the air
hose full of water so that everything was
completely free of bubbles. We then placed
the bottle on the test stand and suspended
the hose vertically so that potentially any
remaining bubbles would float to the top of
the hose.
From
previous experiments we know that a
standard
2L
bottle increases its volume by 157mL or
7.5%
when pressurised to 120psi.
Results
Three horizontal experiments were carried
out to measure the thrust produced by bottle
stretching alone. One vertical experiment
was also carried out to compare how
much thrust a typical 2L bottle produces at
the same pressure and same nozzle using the
same measuring equipment.
The bottle capacity was
2096mL and was pressurised to 120psi.
First horizontal test setup.
Firing horizontally eliminates
the effects of gravity on the
thrust reading as the bottle
loose water.
Attaching the nozzle and
release head to the bottle while
completely submerged under water
to eliminate bubbles.
The bottle is suspended at
one end by a string, while the
other end is attached to the
load cell.
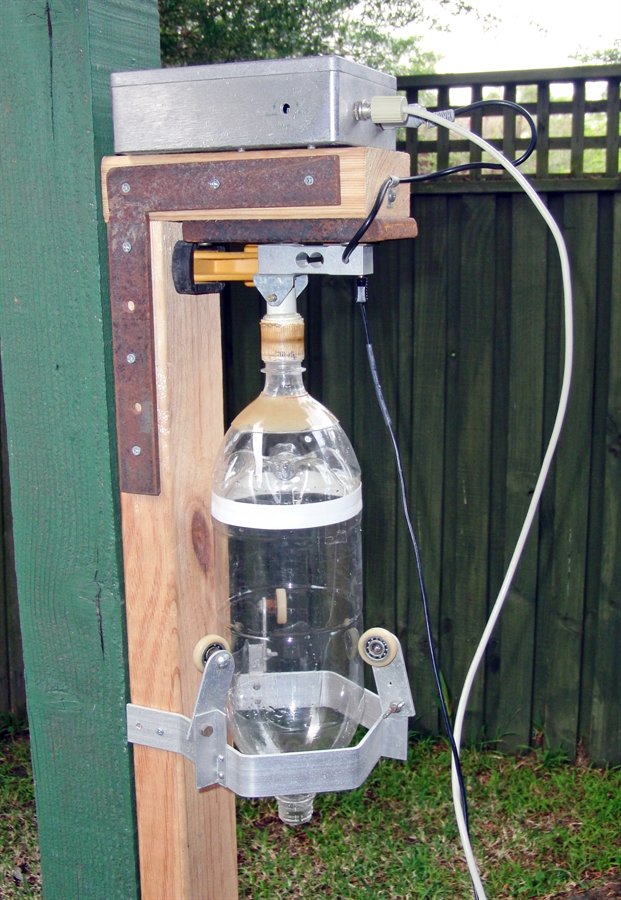
Test #4 was carried out
vertically. The support brace
around the bottle keeps it
aligned but allows it to move
freely up and down.
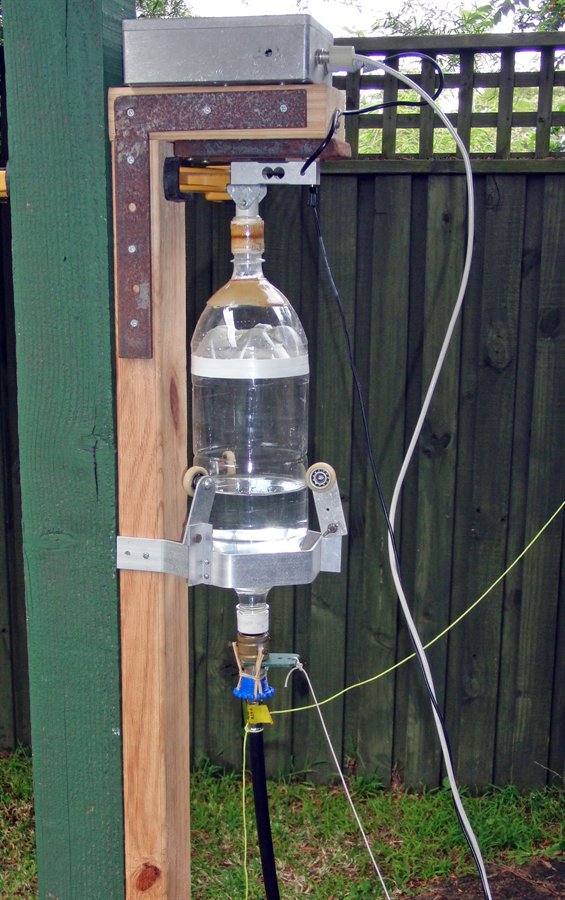
Here it is connected to the
air hose and release mechanism.
A non return valve is built into
the release head. The bottle was
filled with 800mL of water.
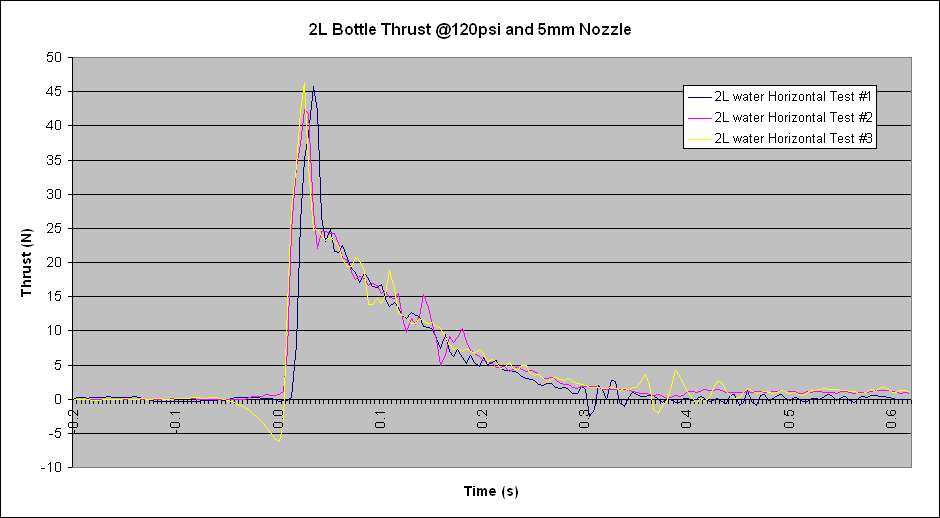
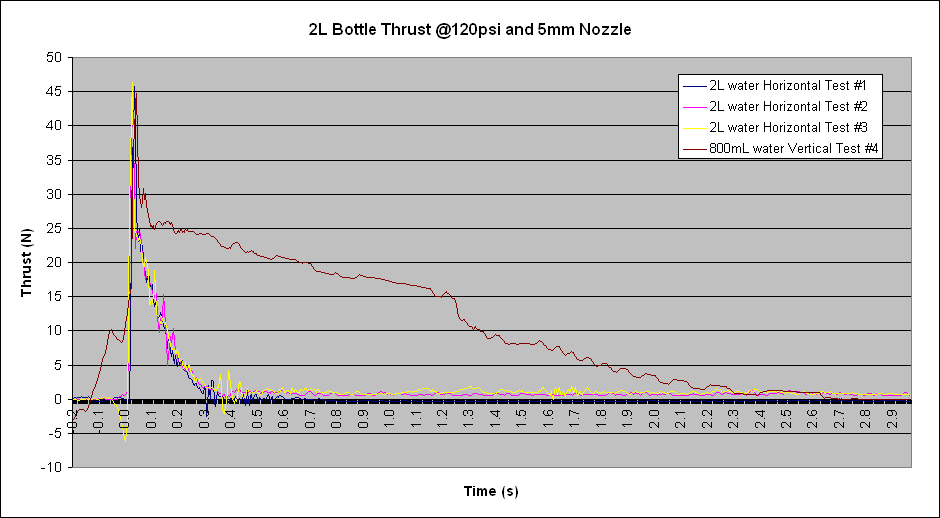
The following graph shows the recorded
thrust curves for all three horizontal
tests. All 3 thrust curves have a similar
shape and timing.
Graph 1 - 3 Horizontal tests
The following graph shows the 3 horizontal
thrust curves with the vertical test thrust
curve using air
and 800mL of water.
Graph 2 - Comparison of normal thrust
curve and the bottle stretching thrust
curves.
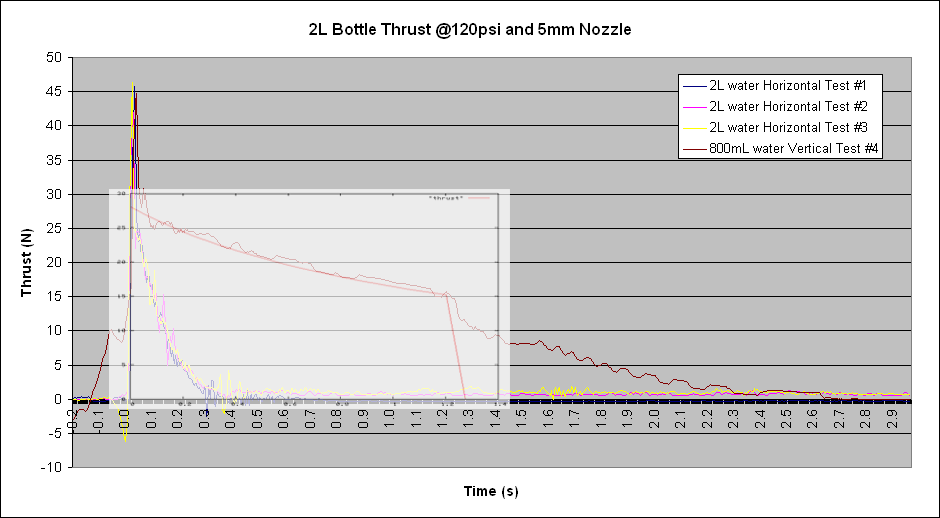
The following graph superimposes the
Simulation results from
Clifford Heath's
simulator thrust curve confirming that the
measured results are in close agreement with
simulation results.
Graph 3 - Theoretical thrust curve
superimposed on the measured results.
The data from the load cell was then further
processed in an Excel spreadsheet. The data
was first filtered with a 5 point moving
average before the total impulse was
calculated. The vertical experiment data
also had water loss compensation added for
the water phase part of the thrust curve.
The following table lists the total impulse
for each test run.
Test #
Total
Impulse
Notes
1
3.30 Ns
Horizontal, 2L water only
2
3.64 Ns
Horizontal, 2L water only
3
3.65 Ns
Horizontal, 2L water only
4
31.68 Ns
Vertical, 800mL of water
Table 1. - Measured total
impulse
In the 3 horizontal
experiments no bubbles were observed in
the bottle.
Conclusion
This experiment showed what the upper bound
is for the thrust produced by stretching
alone. It is only an upper bound as in a
real rocket the energy is returned over the
entire boost period which
includes the air pulse. In an ideal rocket
with 1/3 the volume filled with water the
energy returned during the water phase will
span a pressure
drop of
~40psi. (Going from 120psi to 80psi during
the water phase).
The rest of the energy is returned during
the air pulse as the pressure drops from
80psi to atmospheric. But the impulse
normally produced during the air pulse is
approximately 1/3 of the total impulse.
Taking this into consideration
the net thrust produced during a real launch from bottle stretching is
likely to be around 1/2 of the
thrust measured in this experiment.