 |
 |
|
|
last updated: 9th November 2024 - Day 236 - Launch Tubes #2 |
|
|
|
Splicing Bottles AS#5 |
|
#235 - Coming Soon |
|
#234 - Coming Soon |
|
#233 - Coming Soon |
|
#232 - Coming Soon |
|
#196 - Coming Soon |
|
#193 - Coming Soon |
|
#172 - Coming Soon |
|
|
| FLIGHT LOG | ||||||||||||||||||||||||||||||||||||||||||||||||||||||||||||||||||||||||||||||||||||||||||||||||||||||||||||||||||||||||||||||||||||||||||||||||||||||||||||||||||||||||||||||||||||||||||||||||||||||||||||||||||||||||||||||||||||||||||||||||||||||||||||||||||||||||||||||||||||||||||||||||||||||||||||||||||||||||||||||||||||||||||||||||||||||||||||||||||||||||||||||||||||||||||||||||||||||||||||||||||||||||||||||||||||||||||||||||||||||||||||||||||||||||||||||||||||||||||||||||||||||||||||||||||||||||||||||||||||||||||||||||||||||||||||||||||||||||||||||||||||||||||||||||||||||||||||||||||||||||||||||||||||||||||||||||||||||||||||||||||||||||||||||||
|---|---|---|---|---|---|---|---|---|---|---|---|---|---|---|---|---|---|---|---|---|---|---|---|---|---|---|---|---|---|---|---|---|---|---|---|---|---|---|---|---|---|---|---|---|---|---|---|---|---|---|---|---|---|---|---|---|---|---|---|---|---|---|---|---|---|---|---|---|---|---|---|---|---|---|---|---|---|---|---|---|---|---|---|---|---|---|---|---|---|---|---|---|---|---|---|---|---|---|---|---|---|---|---|---|---|---|---|---|---|---|---|---|---|---|---|---|---|---|---|---|---|---|---|---|---|---|---|---|---|---|---|---|---|---|---|---|---|---|---|---|---|---|---|---|---|---|---|---|---|---|---|---|---|---|---|---|---|---|---|---|---|---|---|---|---|---|---|---|---|---|---|---|---|---|---|---|---|---|---|---|---|---|---|---|---|---|---|---|---|---|---|---|---|---|---|---|---|---|---|---|---|---|---|---|---|---|---|---|---|---|---|---|---|---|---|---|---|---|---|---|---|---|---|---|---|---|---|---|---|---|---|---|---|---|---|---|---|---|---|---|---|---|---|---|---|---|---|---|---|---|---|---|---|---|---|---|---|---|---|---|---|---|---|---|---|---|---|---|---|---|---|---|---|---|---|---|---|---|---|---|---|---|---|---|---|---|---|---|---|---|---|---|---|---|---|---|---|---|---|---|---|---|---|---|---|---|---|---|---|---|---|---|---|---|---|---|---|---|---|---|---|---|---|---|---|---|---|---|---|---|---|---|---|---|---|---|---|---|---|---|---|---|---|---|---|---|---|---|---|---|---|---|---|---|---|---|---|---|---|---|---|---|---|---|---|---|---|---|---|---|---|---|---|---|---|---|---|---|---|---|---|---|---|---|---|---|---|---|---|---|---|---|---|---|---|---|---|---|---|---|---|---|---|---|---|---|---|---|---|---|---|---|---|---|---|---|---|---|---|---|---|---|---|---|---|---|---|---|---|---|---|---|---|---|---|---|---|---|---|---|---|---|---|---|---|---|---|---|---|---|---|---|---|---|---|---|---|---|---|---|---|---|---|---|---|---|---|---|---|---|---|---|---|---|---|---|---|---|---|---|---|---|---|---|---|---|---|---|---|---|---|---|---|---|---|---|---|---|---|---|---|---|---|---|---|---|---|---|---|---|---|---|---|---|---|---|---|---|---|---|---|---|---|---|---|---|---|---|---|---|---|---|---|---|---|---|---|---|---|---|---|---|---|---|---|---|---|---|---|---|---|---|---|---|---|---|---|---|---|---|---|---|---|---|---|---|---|---|---|---|---|---|---|---|---|---|---|---|---|---|---|---|---|---|---|---|---|---|---|---|---|---|---|---|---|---|---|---|---|---|---|---|---|---|---|---|---|---|---|---|---|---|---|---|---|---|---|---|---|---|---|---|---|---|---|---|---|---|---|---|---|---|---|---|---|---|---|---|---|---|---|---|---|---|---|---|---|---|---|---|---|---|---|---|---|---|
|
||||||||||||||||||||||||||||||||||||||||||||||||||||||||||||||||||||||||||||||||||||||||||||||||||||||||||||||||||||||||||||||||||||||||||||||||||||||||||||||||||||||||||||||||||||||||||||||||||||||||||||||||||||||||||||||||||||||||||||||||||||||||||||||||||||||||||||||||||||||||||||||||||||||||||||||||||||||||||||||||||||||||||||||||||||||||||||||||||||||||||||||||||||||||||||||||||||||||||||||||||||||||||||||||||||||||||||||||||||||||||||||||||||||||||||||||||||||||||||||||||||||||||||||||||||||||||||||||||||||||||||||||||||||||||||||||||||||||||||||||||||||||||||||||||||||||||||||||||||||||||||||||||||||||||||||||||||||||||||||||||||||||||||||||
| Day 165 - Liquid Density Experiment - Part 2 | ||||||||||||||||||||||||||||||||||||||||||||||||||||||||||||||||||||||||||||||||||||||||||||||||||||||||||||||||||||||||||||||||||||||||||||||||||||||||||||||||||||||||||||||||||||||||||||||||||||||||||||||||||||||||||||||||||||||||||||||||||||||||||||||||||||||||||||||||||||||||||||||||||||||||||||||||||||||||||||||||||||||||||||||||||||||||||||||||||||||||||||||||||||||||||||||||||||||||||||||||||||||||||||||||||||||||||||||||||||||||||||||||||||||||||||||||||||||||||||||||||||||||||||||||||||||||||||||||||||||||||||||||||||||||||||||||||||||||||||||||||||||||||||||||||||||||||||||||||||||||||||||||||||||||||||||||||||||||||||||||||||||||||||||||
|
Date: 5th
September 2015 Location: Whalan Reserve, NSW, Australia Conditions: Calm <~5km/h, sunny 20C, Team Members at Event: GK and Paul K. Liquid Density Experiment - Part 2Video
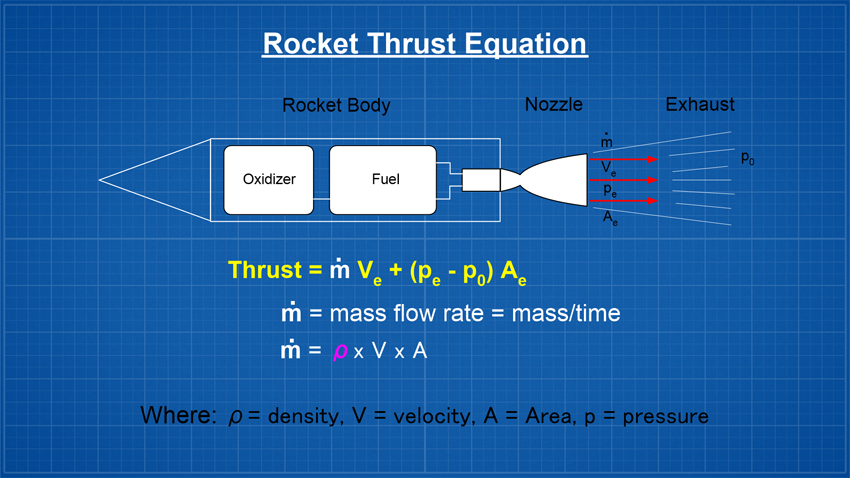
AimTo investigate how different liquid densities (at the same volume) affect water rocket performance. TheoryLooking at the traditional thrust equation below, we see that thrust or the force produced by the rocket is proportional to the mass flow rate (m-dot). So if we keep everything else constant in the equation, and increase the density, it should result in greater thrust and therefore it should also follow that the rocket goes higher. However, greater thrust doesn't represent the whole picture!
If you increase the density of the liquid you may produce
greater thrust but you are also making the liquid that's still
inside the rocket heavier and so you have to lift more weight
which works against the greater thrust.
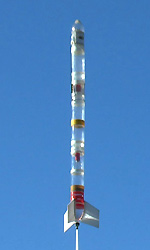
Other than weight there are a number of other factors that affect a water rockets final altitude, such as the drag coefficient, launch pressure, nozzle size, launch tube size and length, nozzle efficiency, air density etc. The actual mathematics behind how a water rocket's maximum altitude can be estimated is a lot more complicated and I highly recommend reading Dean Wheeler's detailed analysis on this subject. SimulationsWe first ran a number of simulations for the following rocket that we fly regularly. From past experience we know that Clifford Heath's simulator is fairly accurate in predicting the rocket's performance.
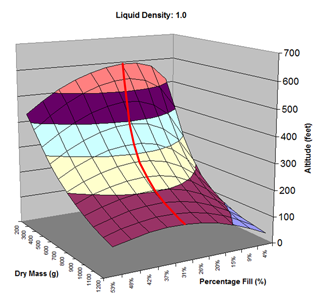
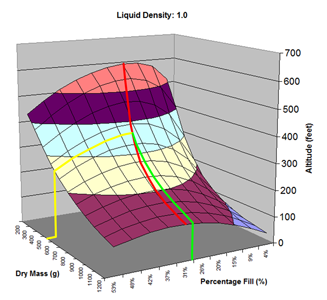
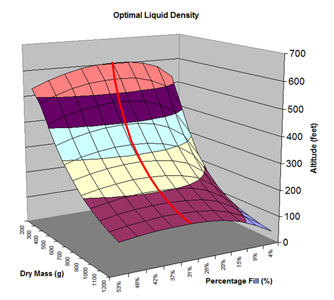
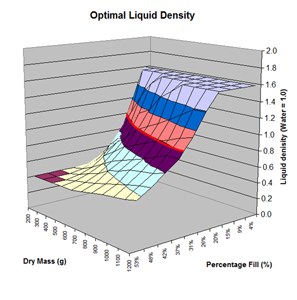
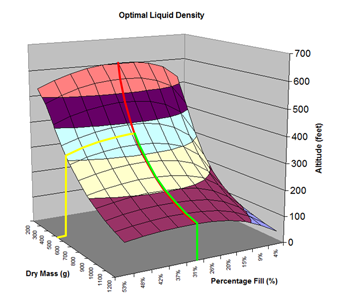
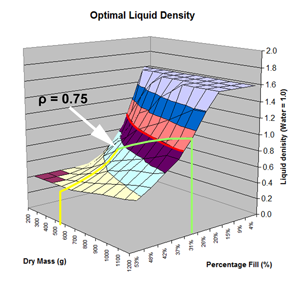
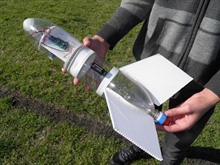
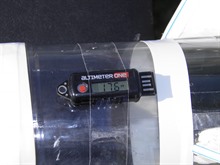
Here are the simulation results. Each of the points on the surface of Graph 1 represents one simulation run. Along the bottom axis we have the rocket's dry weight, while the other axis is water fill amount as a percentage of the total volume and vertically is the predicted altitude. The liquid density for these first simulations was set to 1 representing water. The red line represents the optimal water amount needed to reach maximum altitude. Note that the optimal percentage changes depending on the dry weight of the rocket. For this rocket that weighs 550grams, we can see that we need close 29% water fill to reach maximum altitude. (Graph 2.) We ran the simulations again, but this time for each point on the graph (Graph 3.), we let the simulator run another whole series of simulations that varied the density between 0.4 and 1.6. The simulator then found which density achieved the greatest altitude. Here we are plotting the altitudes again in relation to the dry weight of rocket and the percentage water fill. At the same time the simulator not only gives us the maximum altitude, but also tells us what density would give us that optimal altitude. So we plot the optimal density on Graph 4. The graph again has the dry rocket weight along this axis and the water fill percentage along this one with the optimal density on the vertical axis. The red line represents the density of water. Anything on the upper side of the line means a higher density liquid achieved greatest altitude while everything on the lower side achieved greatest altitude with a lower density liquid. Each point on Graph 4 corresponds to a point on Graph 3. So for this particular rocket that weighs 550grams, we can see that the optimal fill percentage this time is closer to 31% (Graph 5.) and it corresponds to a density of about 0.75. (Graph 6) However, the difference in predicted altitude is only about 4 feet higher (362 feet [110m]) with the optimized density vs plain water (358 feet [109m]) That corresponds to only about 1-2% of the overall altitude so its quite small. You can also see from this graph that if the rocket weighed more that 1Kg then the rocket would perform better if it used a liquid denser than water. Practical Experiment - MethodFor the purposes of this experiment, the performance of the water rocket is measured by the altitude it achieves. The higher the rocket flies the higher its performance. A rocket with the following parameters was made for this experiment. A small volume rocket was chosen to reduce the amount of different density liquids that would be needed for multiple flights. It also represents a typical small water rocket flown by many students. The rocket uses a parachute deployed by a timer to bring it back safely after each launch. The timer was adjusted so that the parachute opened well after apogee allowing a clean maximum altitude reading to be obtained. The altitude was measured using the AltimeterOne barometric altimeter with a resolution of 1 foot. The following liquids were prepared for comparison.
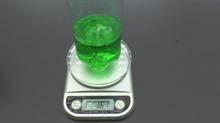
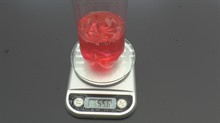
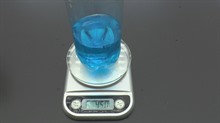
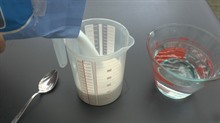
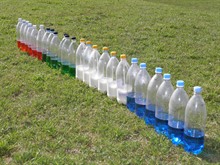
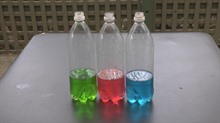
The sugar solution was prepared by dissolving 700grams of sugar in warm water, and adding enough water to make up to 1100mL. Three drops of food dye were added to each liquid to make it easy to identify which liquids were used in photos and video. The ice cream was first melted and measured also by volume and it had the lowest density because it was full of bubbles. The problem, however, was that by the next day a lot of the bubbles escaped and so the 450mL of measured volume was actually closer to 250-300mL. For this reason we did not use it in the comparison flights. We did fly it a couple of times just to see what would happen though. The rocket was launched at 120psi (8.3 bar). Consistency between launches was achieved by setting the pressure regulator to one setting and leaving it there for all of the flights. 450mL of liquid was used for each launch as it is close to the ideal 1/3 capacity of the rocket. We measured the exact amounts into individual bottles the night before launch to make it easier to conduct the experiment on the day. Six flights were performed with each liquid type and the results were recorded. ResultsFollowing is a table of all the flights and their recorded altitudes.
The results have been grouped by fuel in the graph below. The graph also shows the average altitude for each liquid.
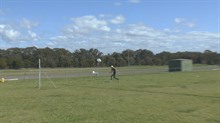
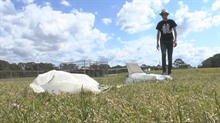
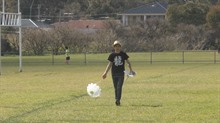
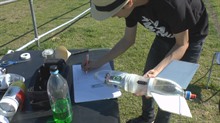
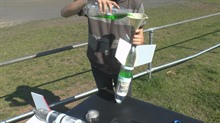
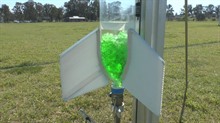
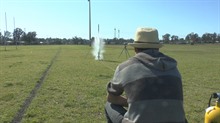
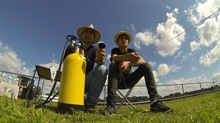
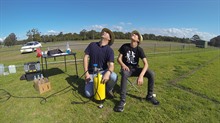
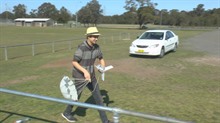
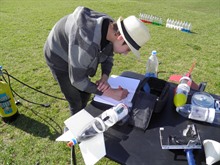
Here are some photos from the experiment:
Sources of ErrorsThe variations in the measurements for each fuel type were due to a number reasons including the following:
ConclusionFor this particular rocket configuration and launch pressure, the obtained results seem to confirm the simulator predictions that higher density liquids can perform worse than lower density ones at the same volume. The sugar solution which was 25% more dense made the rocket fly 4% lower than normal water. The alcohol which was 20% less dense, made the rocket fly 2.9% higher than the normal water. Practical implicationsThe differences in altitude were small when comparing the different liquid densities to pure water. If you are looking to get peak performance from your rocket, there are better ways to create a low density liquid than using volatile liquids like alcohol. See foam vs water comparisons - Day 144. Miscellaneous
References
Flight Details
|
