 |
 |
|
|
last updated: 9th November 2024 - Day 236 - Launch Tubes #2 |
|
|
|
Splicing Bottles AS#5 |
|
#235 - Coming Soon |
|
#234 - Coming Soon |
|
#233 - Coming Soon |
|
#232 - Coming Soon |
|
#196 - Coming Soon |
|
#193 - Coming Soon |
|
#172 - Coming Soon |
|
|
| FLIGHT LOG | ||||||||||||||||||||||||||||||||||||||||||||||||||||||||||||||||||||||||||||||||||||||||||||||||||||||||||||||||||||||||||||||||||||||||||||||||||||||||||||||||||||||||||||||||||||||||||||||||||||||||||||||||||||||||||||||||||||||||||||||||
|---|---|---|---|---|---|---|---|---|---|---|---|---|---|---|---|---|---|---|---|---|---|---|---|---|---|---|---|---|---|---|---|---|---|---|---|---|---|---|---|---|---|---|---|---|---|---|---|---|---|---|---|---|---|---|---|---|---|---|---|---|---|---|---|---|---|---|---|---|---|---|---|---|---|---|---|---|---|---|---|---|---|---|---|---|---|---|---|---|---|---|---|---|---|---|---|---|---|---|---|---|---|---|---|---|---|---|---|---|---|---|---|---|---|---|---|---|---|---|---|---|---|---|---|---|---|---|---|---|---|---|---|---|---|---|---|---|---|---|---|---|---|---|---|---|---|---|---|---|---|---|---|---|---|---|---|---|---|---|---|---|---|---|---|---|---|---|---|---|---|---|---|---|---|---|---|---|---|---|---|---|---|---|---|---|---|---|---|---|---|---|---|---|---|---|---|---|---|---|---|---|---|---|---|---|---|---|---|---|---|---|---|---|---|---|---|---|---|---|---|---|---|---|---|---|---|---|---|---|---|---|---|---|---|---|---|---|---|---|---|---|
|
||||||||||||||||||||||||||||||||||||||||||||||||||||||||||||||||||||||||||||||||||||||||||||||||||||||||||||||||||||||||||||||||||||||||||||||||||||||||||||||||||||||||||||||||||||||||||||||||||||||||||||||||||||||||||||||||||||||||||||||||
| Day 159 - Measurement Errors | ||||||||||||||||||||||||||||||||||||||||||||||||||||||||||||||||||||||||||||||||||||||||||||||||||||||||||||||||||||||||||||||||||||||||||||||||||||||||||||||||||||||||||||||||||||||||||||||||||||||||||||||||||||||||||||||||||||||||||||||||
|
Date:
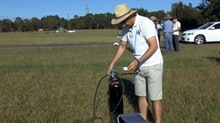
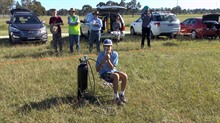
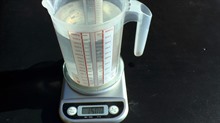
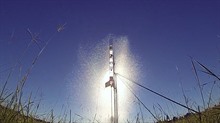
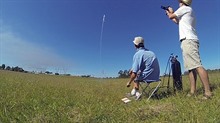
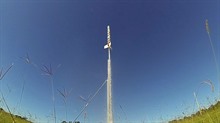
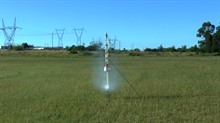
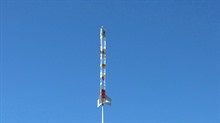
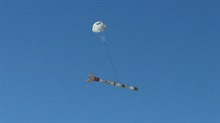
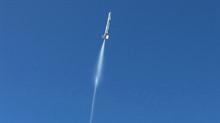
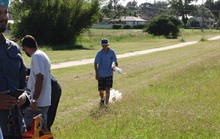
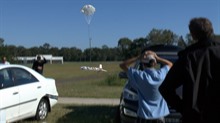
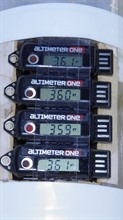
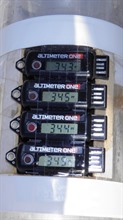
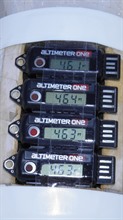
28th March 2015 Location: Whalan Reserve, NSW, Australia Conditions: Clear skies, calm to light winds 0-5km, ~24C Team Members at Event: Paul K and GK, MeasurementThis week we look at measuring water rocket flight performance. When doing experiments that affect the performance of a water rocket you need to be able to measure how much better or worse the rocket performs with each change. The problem, however, is that the errors in your measurement may be greater than the effect you are trying to measure. There are multiple performance parameters you can look at such as altitude, acceleration , speed, flight time, etc. depending which parameter you are trying to optimize. Typically peak altitude or flight duration are commonly used and so we'll focus on those in this experiment. AimTo look at the variability in measurements between similar altimeters on the same flight and the variability of those measurements between successive flights under the same conditions. We also compare the flight duration variability on the same flights MethodFor this experiment we used our Axion II rocket and installed 4 x AltimeterOne's next to each other. Each launch was pressurised to 120psi. This was done by setting the pressure regulator to one setting and then leaving it on that setting for all launches. The rocket was launched after air stopped flowing into the rocket. Each flight used 1500mL of water measured on a scale to minimize performance variation due to the water amount. Weather conditions remained mostly consistent during the experiment with calm to light winds. Flight durations were measured using recorded video. The measurements were taken from the rocket leaving the pad to the first contact with the ground. The landing area was level. We performed 5 flights with water only, and two additional ones with 1500mL of water/foam solution. Here are some photos from the experiment: ResultsHere is a summary of the flight results:
AnalysisDifferences in Altimeter readingsAs we can see from the data the altimeter readings for two of the flights (#1 and #4) were within 2% of each other, with the rest of the flights within 1%. For these flights that represents a difference of +/- 3 feet. This is fairly good considering the altimeters are only measuring air pressure. It also means that the readings are fairly consistent between the altimeters.
Differences between individual flightsTo compare the differences in altitude between individual flights (#1 to #5), we use the average of the 4 altimeter readings on each flight, and then compared those. The difference in altitude between individual flights is more significant and when we look at the averaged altitudes we see that they were within 12% of each other. The first flight was out considerably so looking at flights #2 to #5 the difference was only 4.5%. For flights #6 and #7 with foam the difference was about 7%. This can be significant if you are trying to measure subtle changes to the design of the rocket. The variations can be due to any number of factors such as slight differences in the launch pressure, temperature, launch angle and environmental conditions such as cross wind, thermals and wind gusts. It would not be unreasonable to expect errors as much as 10% when comparing separate flights under the same conditions.
Differences in flight durationsAlthough the rocket used the same parachute deployment time delay for all flights the differences in flight durations were even more significant. This is due to a number of factors such the time it takes for the parachute to fully inflate which in turn can be caused by variations in packing technique, and aerodynamic environment around the rocket at the time of deploy. Other factors include thermals changing the descent rate, and the attitude of the rocket under parachute which can change the the total drag coefficient resulting in different descent rates. The descent times varied as much as 29%!
ConclusionAlthough the numbers given here are specific to this rocket, it does give a representative idea of what to expect when performing your own experiments. The errors can be significant and may completely swamp any minor performance differences you are trying to measure. This means for expected minor changes in performance, you typically need to perform many flights and average those to see the differences. Highlights VideoFlight Details
|
